
Working Papers
Beyond the Flypaper Effect: Crowding-In from Federal Investment in Public Transit
Abstract
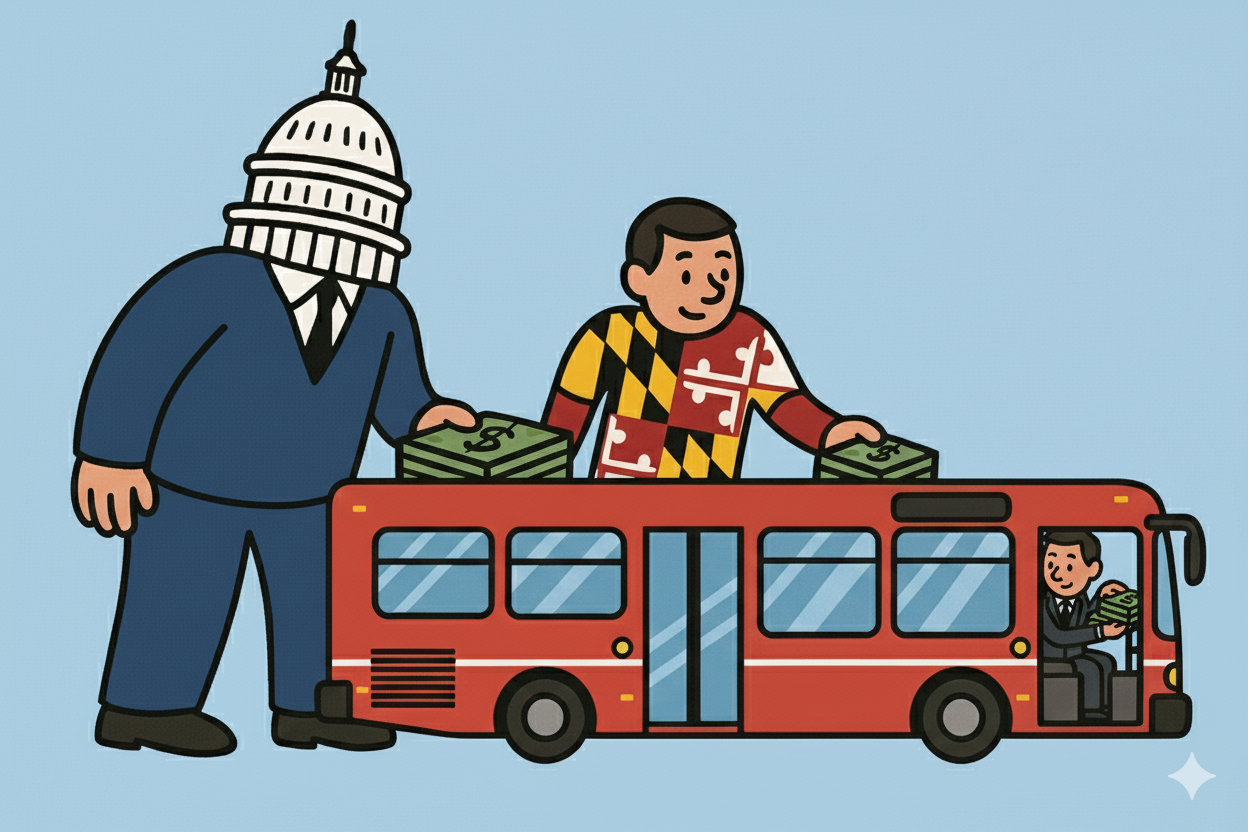
I examine how targeted federal grants affect spending on public transit in a three-level fiscal system. The analysis uses comprehensive U.S. expenditure data from 2000–2019 and exploits an exogenous shock from the 2009 American Recovery and Reinvestment Act (ARRA). ARRA funds were apportioned to Urbanized Areas through preexisting formula programs, independent of potential changes in transit investment. I find that each $1 of ARRA apportionment led to an additional $1.76 of capital spending from all sources over 2009–2019, or $2.31 when scaled by the first-stage effect on federal capital grants. This reflects two distinct phases: an initial rise in federally funded expenditures with no displacement of state or local spending (the flypaper effect), followed by substantial crowding-in of state funding to the same localities. This additional spending was directed primarily toward maintaining existing bus fleets and did not increase service provision or ridership. Cross-state variation in institutional characteristics points to the negotiation channel as the primary mechanism: ARRA lowered the cost for local officials of securing flexible state funding. In the largest cities, crowding-in may also have been amplified by the attractiveness of continued investment in large ongoing projects.
Where Did the Money Go? Transit Project Selection Under ARRA
Abstract
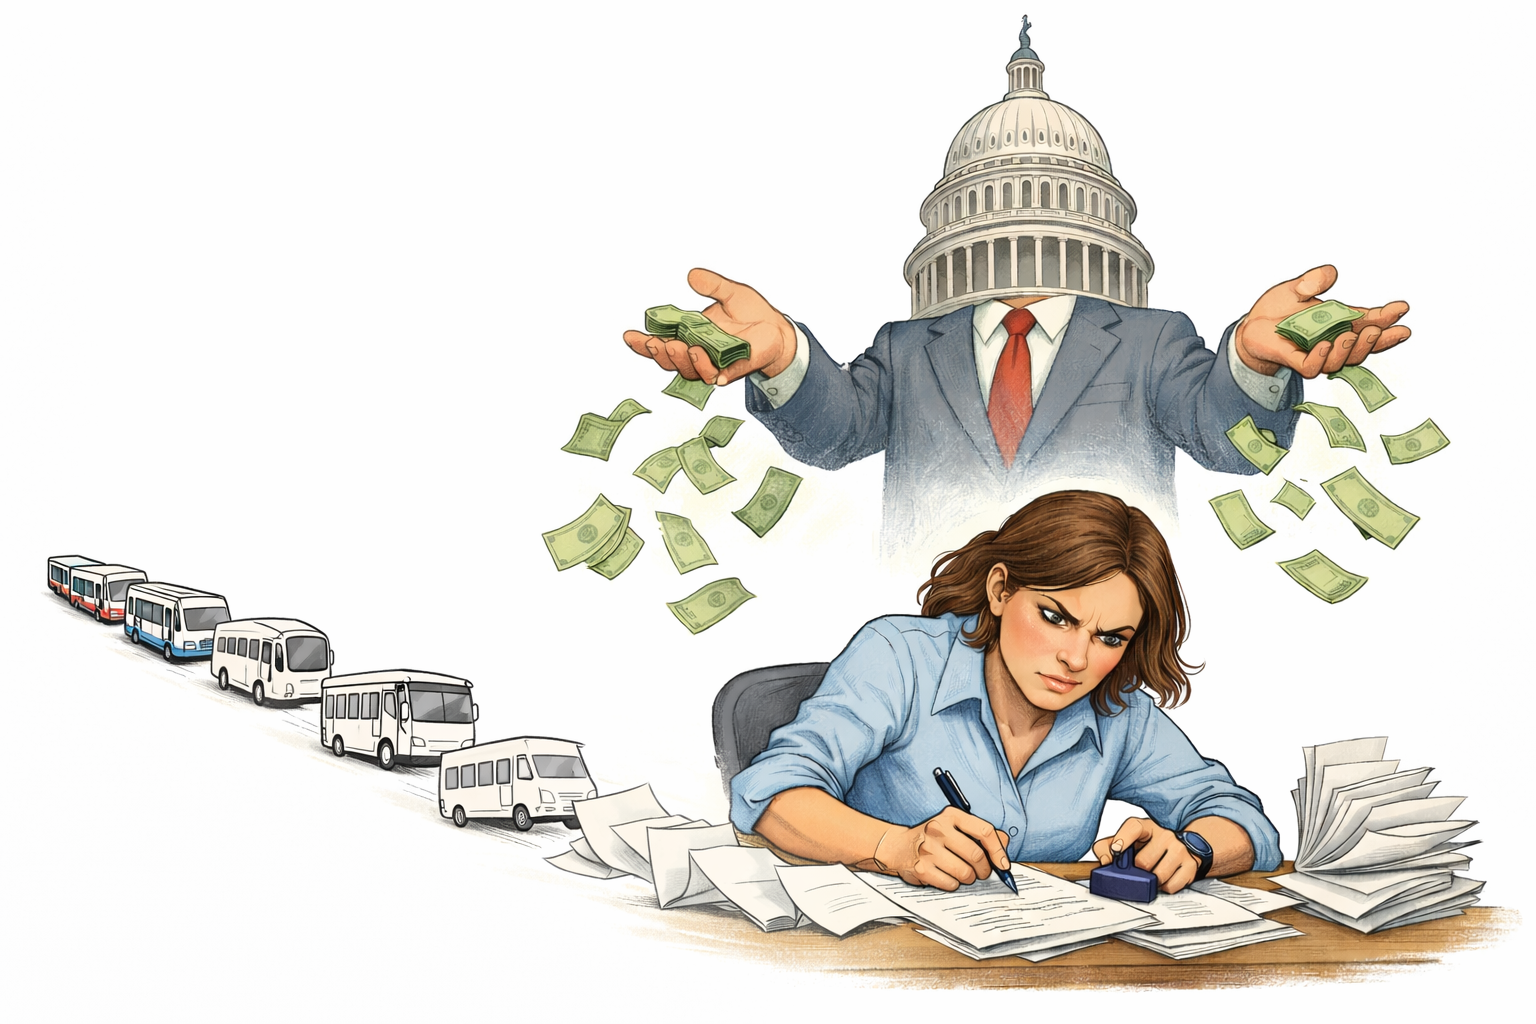
I study how local transit agencies spent $8.4 billion of one-time capital from the 2009 stimulus, distributed by a formula and left to local discretion. Using a large language model to extract project-level data from grant texts, I find that 22 percent of projects added service capacity, 30 percent improved the quality of existing service, and 48 percent maintained it, while agencies' preexisting characteristics explain almost none of this split. On the other hand, the type of spending mattered for the outcomes: areas that spent on expansion fared no differently from those that spent on maintenance, while areas that spent on quality improvement provided more service afterward. A simple model explains why. A system with excess capacity already carries the riders its quality attracts, so added vehicles sit unused and only an improvement in quality can attract new passengers. Empirical results thus suggest that the average American transit system overinvests in capacity and underinvests in quality. A back-of-the-envelope reallocation toward quality implies roughly 3 to 4 percent more national ridership.
In the Weeds of Traffic Fatalities: Revisiting the Effect of Medical Marijuana Laws
Abstract
This study re-examines the finding by Anderson, Hansen, and Rees (2013) that medical marijuana laws decrease traffic fatality rates by 10.4%. I demonstrate that legalizing states were already experiencing declining fatalities prior to legalization, even after controlling for state-specific linear trends in a Two-Way Fixed Effects model. To address these pre-trends, I apply the Imputation Procedure (IP) by Borusyak, Jaravel, and Spiess (2024), which estimates state-specific trends using only not-yet-treated observations. Depending on the inclusion of potentially confounding covariates, my IP estimates suggest either a 12% increase or a zero effect on fatalities. I also show that the average state effect differs substantially from the average individual effect, indicating large heterogeneity across states. Much of the original negative result is driven by California, which accounts for over half of the population-weighted estimate. This state consistently exhibits one of the largest estimated negative effects and one of the steepest negative pre-trends.